Business intelligence (BI) and analytics tools have significantly increased in market share over the past ten years as a result of the rise of Big Data and the growing requirement to make important business decisions in a condensed amount of time. Along with the development of technology and rising investment, this trend is anticipated to continue developing steadily.
Data visualization, when paired with the skills of the analyst and the methods required to find the data, has become a crucial part of the analytical process enabling data analysts to communicate information to decision-makers in an understandable and actionable fashion. Long-form narrative forms, such as scrolling or multi-stage dashboards, are increasing and enable analysts to provide a step-by-step methodology to derive insights. Data visualization is revolutionizing how businesses use data and carry out strategies. As a result, implementing business intelligence solutions to make use of cutting-edge analytical techniques aids organizations in improving data literacy to provide actionable insights.
At a predicted CAGR of 5.6% from 2022 to 2028, the size of the global business intelligence (BI) market is expected to increase from US$ 24000 million in 2021 to US$ 35380 million by 2028.
What is Business Intelligence?

Business Intelligence is a modern approach to segregating, normalizing and analyzing business data with the help of various tools and software following set processes.
Raw and mixed data from various sources is converted into a uniform, system-readable format and made easily accessible over cloud systems.
The information harvested from converted data can throw powerful lights into previously undiscovered market trends or customer psychology.
The Components of Business Intelligence
OLAP (Online Analytical Processing)

This is software for the extraction of data from multiple relational data sets and reorganization into a multidimensional data format. OLAP helps in the fast analyzing of data and improves business process.
Advanced Analytics or Corporate Performance Management (CPM)

This tool offers business leaders insight into the statistics of certain products or services. The data can be used for market research before the launch of a new product.
CPM applications typically are used for finance driven processes like budgeting, forecasting, financial consolidation and related reports.
Real-time BI

Real time analytics is becoming increasingly important for today’s businesses. Companies align their offerings with the ongoing trend observed via real time BI.
Limited time special coupons to move the inventory, tracking the most visiting hours on a site and creating engaging offers are done with the help of real time insights.
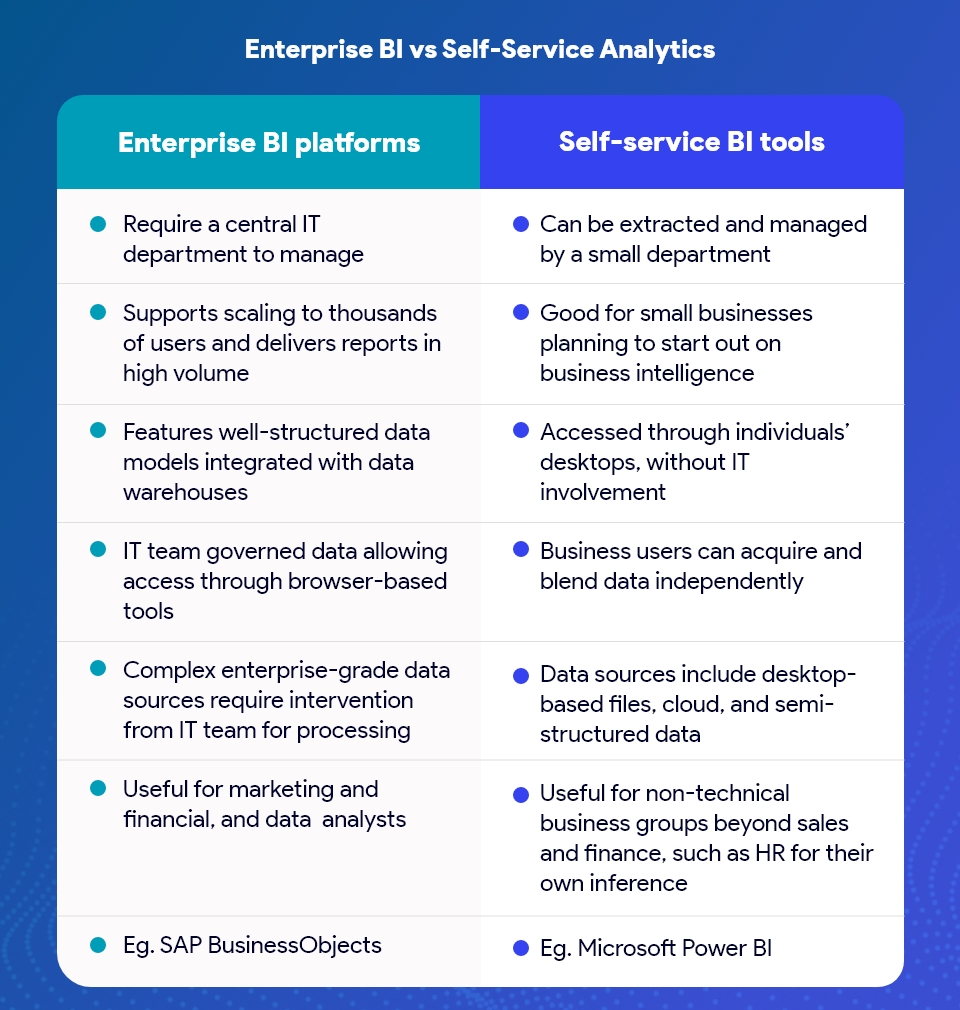
Enterprise BI vs Self-Service Analytics

What is Power BI?

Power BI, is a business analytics solution that lets you visualize your data and share insights across your organization, or embed them in your app or website. With a 36% market share, Power BI is the most popular data analytics platform among businesses. Around the world in 2022, over 54757 companies have started using Microsoft Power BI as a Business Intelligence (BI) tool.
Microsoft Power BI is a web based business intelligence suite of SaaS products, apps, and connectors for data visualization.
Supported with streamlined distribution and integration with other Microsoft products; Power BI turns raw business data into beautiful, immersive, and interactive reports.
Why Power BI?
Power BI developed by Microsoft is a leader in Business Intelligence Suites. Its ease of learning and seamless integration with other Microsoft products makes it an attractive choice among analysts, developers, and business managers alike for data interpretation. Some of the key features which make Power BI stand out from the crowd are:
- Power BI allows direct queries on large-size datasets which helps save time.
- Power BI’s Machine Learning feature enables users to identify important trends and forecast the competitive market.
- High-end processing power aided with the latest algorithms and technology.
- Personalized dashboards for interesting visualization of Data.
- Alerts can be set up based on different metrics and measurements on key performance indicators (KPIs).
- Even a non-technical person can use bespoke dashboards of Power BI to navigate and generate reports processing complex datasets.
- Free business insights on Power BI Desktop make it an attractive choice for small business users with limited requirements.
- Users can resolve problems in real-time from live reports and dashboards updating synchronously with streaming data.
- Integration with other Market charts and analytics of Microsoft, and access to AI assistants like Cortana make working easy with Power BI.
Power BI Components

Power BI comes with a bundle of components to strengthen its various products and create a synergy between them. We will take a look at how they offer adaptability and are very useful to address various business needs.
Power BI Query
Power BI Query is a Data Connectivity and Data Transformation Tool to import and reshape data from a variety of Microsoft products, including Excel, Analysis Services, Databases, and others into a single platform.
Power BI Pivot
It is a data modeling tool for imported data. Data is modeled in excel and visualized as Pivot Tables, Pivot Charts etc.
Power BI View
Power View creates graphs, maps and charts acquiring data from various sources. It comes with a simple drag-and-drop interface and can be integrated over SQL Server or Spreadshare.
Power BI Map
This Power BI Desktop data visualization tool can create maps from thousands of rows of data over Bing Maps for data visualization. Two kinds of Custom maps, bubble maps, and filled maps, can be created with location coordinates.
Power BI Q&A
Power BI Q&A is an interactive tool that can be attached to Cortana for exploring data in an interactive fashion. It uses NLP (natural language processing) to analyze questions, complete queries, and throw interesting data visualization.
Power BI Premium
Allows business analysts to acquire and process big data through low-code data marts all by themselves. Prebuilt connectors for common services like Dynamics 365, Azure Synapse Analytics, Salesforce, Excel, and SharePoint are available for data ingestion. Increased model size and refresh rate allow hassle-free management of large-sized data.
Power BI License

There are three kinds of Power BI per-user licenses: Free, Pro, and Premium Per User (PPU). Which type of license you need is determined by where your content is stored, how you’ll interact with that content, and if that content uses Premium features. The other type of license is a Premium capacity-based license. PPU and Pro users with access to a Power BI Premium capacity-based license, can create content in workspaces that are assigned to Premium capacity. PPU and Pro users can then grant colleagues, including free users, access to those Premium workspaces.
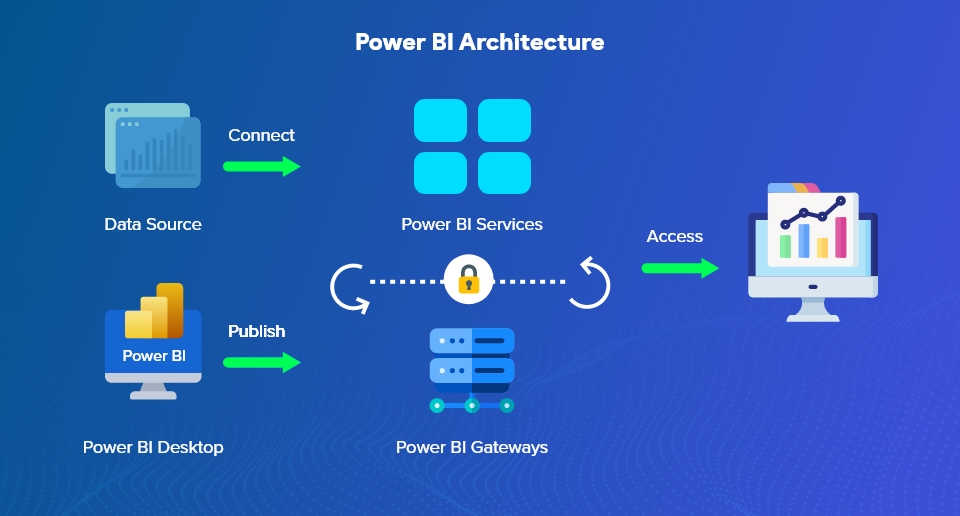
Power BI Architecture

Power BI architecture is a service built on top of Azure.
Users take data using Power Query from various sources like files, Azure source, online services, DirectQuery or gateway sources. Then, Data is cleaned and processed through the Power BI Desktop app.
The data is ready to use for report visualizations once it has been transformed and formatted. An assortment of visualizations, including graphs, charts, tables, filters, and slicers, make up a report.
Reports can be published over Power BI Service or Power BI Report Server.
Power BI Mobile Apps help access reports from any location and stay up to date.
Advantages of Power BI
Affordable Pricing
Power BI is one of the cheapest BI tools to go for small businesses with its attractive pricing. Power BI Desktop is free of cost and already comes with an attractive dashboard.
Excel Integration
Data in Power BI can be stored in Excel format giving a sense of familiarity to its users. This also offers great portability as excel data is accessible by a large number of tools and software and has a huge user community.
Custom Visualization
From KPI’s, Charts, Pivots, Graphs and Maps Power BI offers a wide range of custom visualizations.
Data Accessibility and Interactive visualization
Cloud-based SaaS tools ensure data accessibility from multiple devices across various geographical locations. Easy-to-interact drag-and-drop features on the dashboard along with attractive data visualization make it a very user-friendly BI suite.
Streamlined Updates
Frequent upgrades from Microsoft brings new features and tools important for today’s business analytics. This makes it a popular choice for fast paced business users who always need to be on top of the game.
Integration with other Microsoft Apps
Power BI, connected via Power Automate to other numerous Microsoft Power Platform applications, can be used to build strong end-to-end business solutions. Whether it is lowcode, data integrated Power Apps that run on Android and iOS platform or Power Virtual Agent chatbots that create a pleasant conversational experience for customer and employees, Power BI has it all.
Power BI integration with Azure

Power BI an integrated self-service and business analytics solution, enables sharing of insights through an organization and the visualization of data. Azure Analytics and Power BI together establish a data-driven culture in an organization through their various interesting features.
- Data ingestion and modeling through AI/ML-driven data exploration techniques
- Effortless scaling without latency using Azure data models, enterprise data stores, and databases
- Data protection while exporting to other file types
Share and collaborate data as paginated reports via pre-built connectors like Azure Synapse Analytics, Azure Data Lake Storage, Azure Cosmos DB, Azure Analysis Services, and others.
The indispensable importance of business intelligence
Business intelligence enables business leaders to make meaningful and potent use of data. Organizations can effectively use data to gain competitive advantage over others using BI tools.
Businesses armed with insights can proactively respond to market trends and other external factors.
Despite the massive volumes of raw data that businesses generate and store today, very few are truly using the power of data to generate business insights and bring meaningful transformations.
Business is changing at a fast pace today. Business Intelligence enables today’s business leaders to adapt to the change effectively and lead their organizations with fact-based decisions and a more holistic view of growth potential.